Commuters More Satisfied With Public Transport In 2018
Higher satisfaction likely due to better rail reliability
Commuters were more satisfied with public transport in 2018, according to the annual Public Transport Customer Satisfaction Survey (PTCSS) commissioned by the Public Transport Council (PTC).
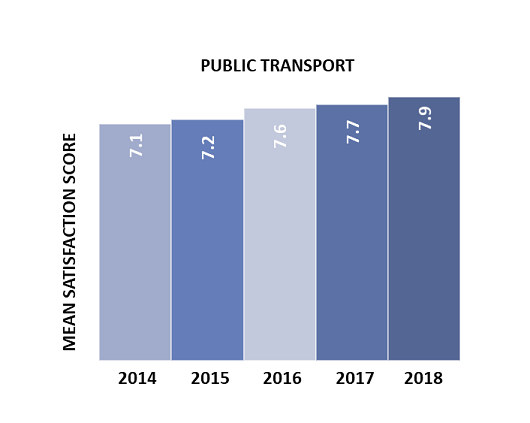
2. The annual survey, which was conducted in October 2018, showed an overall improvement in public transport satisfaction levels over the previous year, with the mean satisfaction score increasing from 7.7 (out of 10) in 2017 to 7.9 in 2018.

Improved Satisfaction with MRT
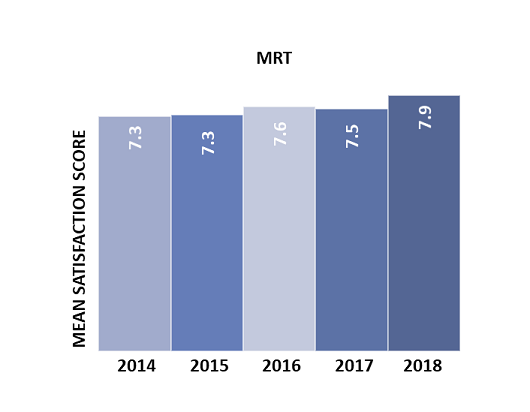
3 Commuter satisfaction with MRT services improved, with the mean satisfaction score rising from 7.5 in 2017 to 7.9 in 2018. Notably, service attributes such as waiting time and reliability saw the biggest improvements in score, up from 7.0 in 2017 to 7.6 in 2018 and 6.7 in 2017 to 7.6 in 2018 respectively.

4 The uptick in commuter satisfaction is a reflection of overall improvements made in rail reliability. Commuters’ mean satisfaction score recorded for reliability rose by 0.9, from 6.7 in 2017 to 7.6 in 2018. This mirrors the significant improvement in the MRT network’s Mean Kilometres Between Failure (MKBF), from 181,000 train-km in 2017 to 690,000 train-km in 2018. This can be attributed to factors such as intensified maintenance efforts and the huge investments put in by the Land Transport Authority and public transport operators to improve rail reliability over the past three years.
5 Besides improving rail reliability, commuters also experienced the benefits of the opening of Downtown Line 3 in October 2017, which could have contributed to the encouraging improvements in mean satisfaction scores for MRT across the board.
Bus Satisfaction Remains High
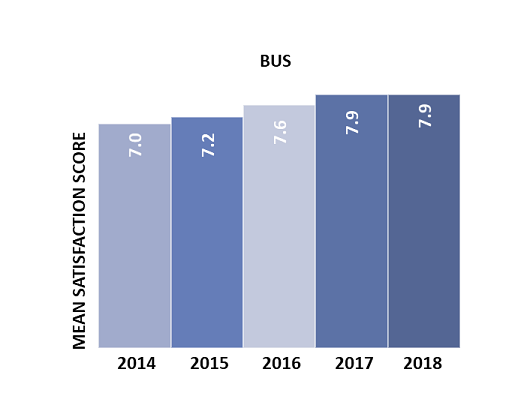
6 Bus services continued to perform consistently well in 2018, maintaining a mean satisfaction score at 7.9. The mean satisfaction scores for service attributes such as waiting time, travel time, and reliability, saw improvements while the mean satisfaction scores for service attributes such as stop/station accessibility dipped in the twelve-month period.

7 Since the implementation of the Bus Contracting Model in 2016, the overall satisfaction with bus services has seen a continued improvement, with the mean score rising from 7.2 in 2015 to 7.9 in 2018.
About the Public Transport Customer Satisfaction Survey
The PTCSS, conducted in October 2018, was carried out by Nexus Link Pte Ltd, an independent market research consultant, among 5,000 commuters across MRT stations, bus interchanges and bus stops during both peak and off-peak hours. This is an annual survey conducted since 2006. The aim of the survey is to understand commuters’ expectations and needs, as well as to identify areas for improvement.
